Daily Leverage Certificates
DLC Hotline: (65) 6226 2828
Market Commentary (Hong Kong)
For the week ending 05 July 2024
The Nikkei 225 printed a fresh new high of 41100. The WTI and Brent Crude gained for the fourth week while the Dollar Index DXY closed at a four-week low.
● The Pentagon is seeking exemption from a 2019 National Defence Authorisation Act that forbids it to use Huawei equipment.
● Japan’s Government Pension Investment Fund is no longer the world’s largest pension fund as the Yen’s depreciation diminished its value in Dollar terms. The Government Pension Fund of Norway is now the largest.
● Greece introduced a six-day work week, becoming the first EU country to do so. Workers could choose a two-hour extension per workday or an additional eight-hour shift per week - for 40% of their regular pay.
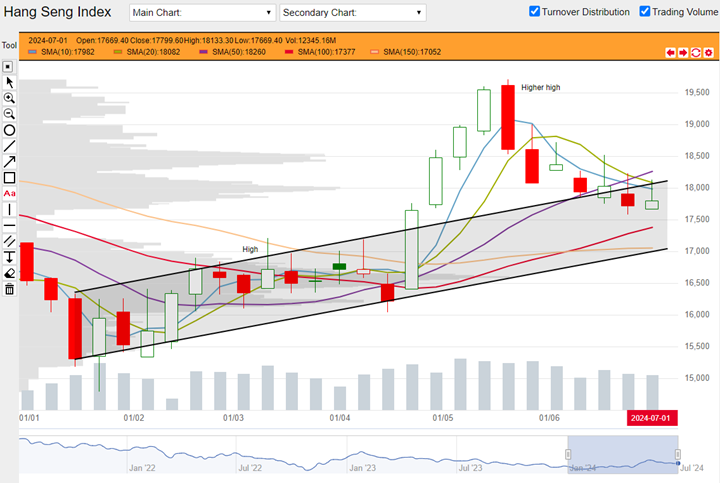
Hang Seng Index closed this week at 17800, up 81 points or 0.46%. As observed in previous commentaries, HSI printed a higher swing high this May compared to March and such a setup is associated with uptrends. As such price action which was falling for the past weeks could be a higher low. Also note the series of golden crosses behind this index and that the 50, 100 and 150-Day SMAs are rising and diverging.

HSI weekly chart from 01 January 2024 to 05 July 2024 (Source: DLC.socgen.com)
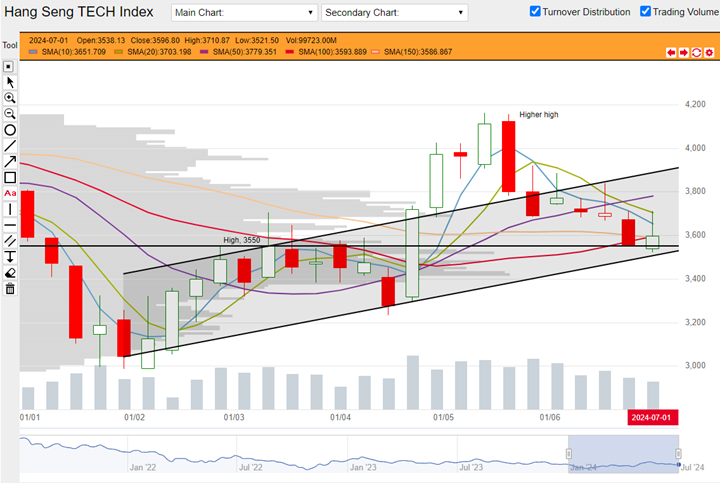
Hang Seng Tech closed the week at 3597, up 42 points or 1.19%. Like the HSI, HSTech has a higher high and potentially higher low structure that is associated with further gains. There is a convergence of themes that could support this week’s positive close. At the swing high printed in March this year, the highest end-of-week close was 3550. HSTech closed at or above this level these two weeks which could be a nod to this level. Secondly there is a rising channel that can be observed and lastly the 100 and 150-Day SMAs (in red and yellow below) which are converging into a golden cross could also provide reference to bulls.

HSTech weekly chart from 01 January 2024 to 05 May 2024 (Source: DLC.socgen.com)
The Dow closed at a seven-week high while the Nasdaq 100 closed at a new all-time-high. In contrast the Russell 2000 which represents small caps closed in the black. Both the Dow and Nasdaq closed above their moving averages which is a setup associated with further gains.
The next FOMC meeting is scheduled on 31 July 2024.
Fed funds futures on rate hike probability by next Fed meeting as at this week’s close:
● 7.8% probability of 25 basis points cut |92.2% probability of no change
Fed funds futures on rate hike probability by next Fed meeting at last week’s close:
● 10.3% probability of 25 basis points cut |89.7% probability of no change
Probabilities on the CME Fedwatch Tool indicate a 25-basis points cut could start as early as the coming FOMC meeting in July. There is also a possibility for a cumulative 100 basis points cut between now to December this year.
Shanghai and Shenzhen continue to fall and both are now at their lowest since mid-February this year. According to political and economic commentary, the market is looking for clues from the third plenary session from 15 - 18 July. It is worthwhile to note that despite the losing close this week, the Shanghai index printed higher and lower tails that exceeded the boundaries of last week’s trading. In chart observations, long tails like these could be found often at swing highs and lows that indicate an increase in interest in the market. New entrants could be expecting a turning point and those long tails are evidence of a tug-of-war.
Other news:
● AIA, Kuaishou, Meituan, Tencent and Xiaomi bought back shares.
● China Mobile, CNOOC and Petrochina printed new 52-week highs. Baidu, Sands China and Wuxi Bio printed new 52-week lows.
● BYD opened its first EV plant in Thailand, which is also the first of its kind in Southeast Asia.
● Douyu International fell to Q1 loss after a slump in live streaming revenue. The company declared a special dividend of $9.80 per ADR. Tencent owns a 38.2% stake in Douyu.
Technical observations
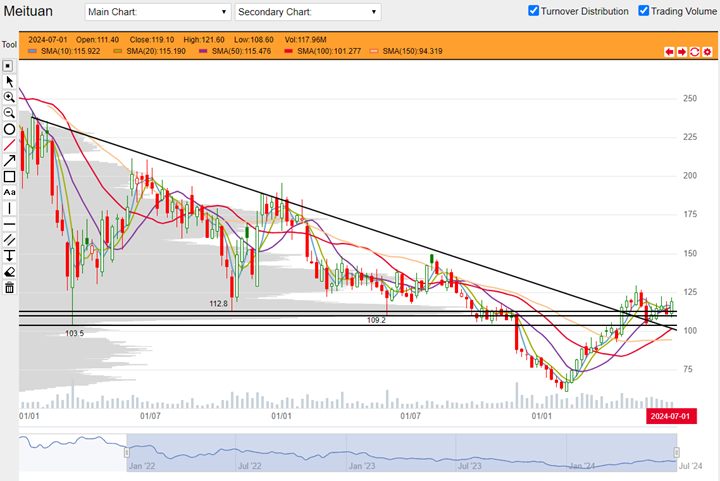
Meituan 3690.hk confluence of overhead trendlines.
Note chart features:
1. Meituan is an outperformer compared to the HSI and HSTech. Between their respective mid-May highs till date, Meituan is down 7.82%, HSI is down 13.59% and HSTech is down 13.59% (not shown in chart). On the chart, this performance from Meituan comes across as a sideway correction while both indices fell. In addition, Meituan closed this week above all of its moving average indicators. This setup is associated with further gains.
2. Note these features. There is a long downwards trendline that is drawn by connecting multiple tops. This trend line was broken. Meituan could be moving towards a range building mode or bullish reversal mode. There were three major bottoms in March and October 2022 as well as May 2023. These closed at lows ranging from $104 to $113. These levels coincide with the lows printed by Meituan over the past few weeks. It is possible that Meituan could be trading in a range complying with these levels.

Meituan 3690.hk weekly chart from 03 January 2022 to 05 July 2024. (Source: DLC.socgen.com)
Underlying Index/Stock |
Underlying Chg (%)1 |
Long DLC (Bid Change%2) |
Short DLC (Bid Change%2) |
|---|---|---|---|
| Hang Seng Index (HSI) | -0.94% | ZOGW (-6.79%) | EUCW (+6.18%) |
| Hang Seng TECH Index (HSTECH) | -1.79% | WYHW (-11.92%) | 9B2W (+12.12%) |
| Meituan (3690.HK) | -1.07% | UOLW (-10.23%) | 96KW (+11.84%) |
Brought to you by SG DLC Team
This advertisement has not been reviewed by the Monetary Authority of Singapore. This advertisement is distributed by Société Générale, Singapore Branch. This advertisement does not form part of any offer or invitation to buy or sell any daily leverage certificates (the “DLCs”), and nothing herein should be considered as financial advice or recommendation. The price may rise and fall in value rapidly and holders may lose all of their investment. Any past performance is not indicative of future performance. Investments in DLCs carry significant risks, please see dlc.socgen.com for further information and relevant risks. The DLCs are for specified investment products (SIP) qualified investors only.
Full Disclaimer - here